160 results found for “computational neuroscience”

Memory study sparks debate over statistical methods
By
Katie Moisse
2 July 2025 | 5 min read
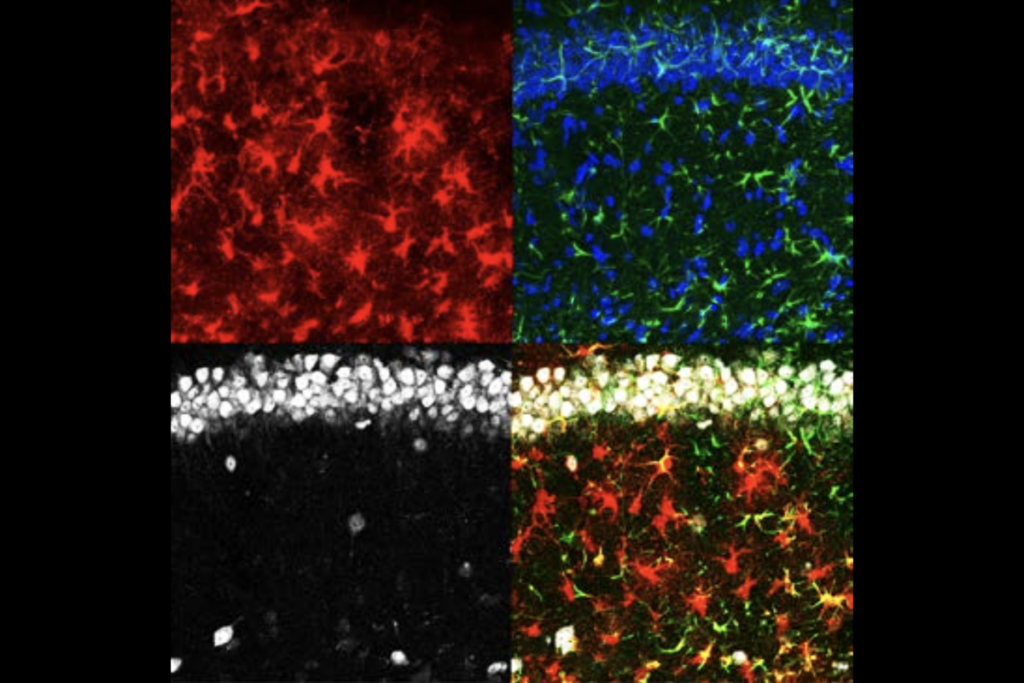
Astrocytes sense neuromodulators to orchestrate neuronal activity and shape behavior
By
Claudia López Lloreda
27 June 2025 | 9 min listen
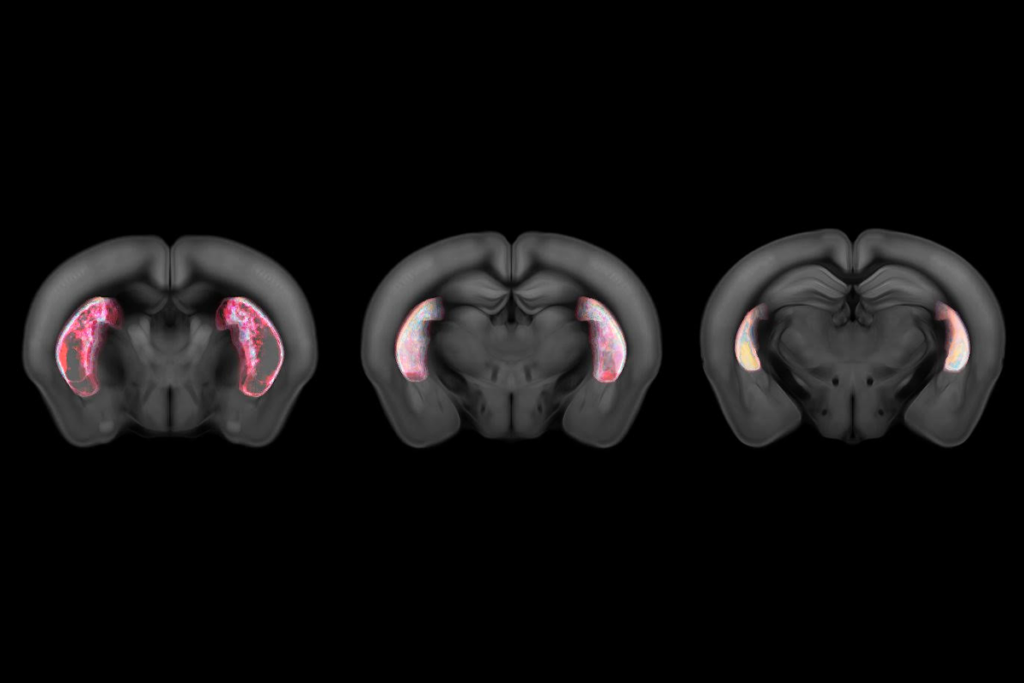
Expanded view of hippocampal function comes into focus
By
Natalia Mesa
24 June 2025 | 11 min listen

NIH cuts quash $323 million for neuroscience research and training
By
Claudia López Lloreda
16 June 2025 | 8 min read
Some dopamine neurons signal default behaviors to reinforce habits
By
Holly Barker
11 June 2025 | 5 min listen
‘Elusive Cures: Why Neuroscience Hasn’t Solved Brain Disorders—and How We Can Change That,’ an excerpt
By
Nicole Rust
10 June 2025 | 9 min read

Convergent effects of autism-linked genes in zebrafish; and more
By
Jill Adams
10 June 2025 | 2 min read

On the importance of reading (just not too much)
By
Sheena Josselyn
9 June 2025 | 9 min listen

Rethinking how neural activity sculpts critical periods
By
Gregg Wildenberg
3 June 2025 | 6 min listen

Learning in living mice defies classic synaptic plasticity rule
By
Sydney Wyatt
28 May 2025 | 6 min listen