Listen to this story:
0:00
/
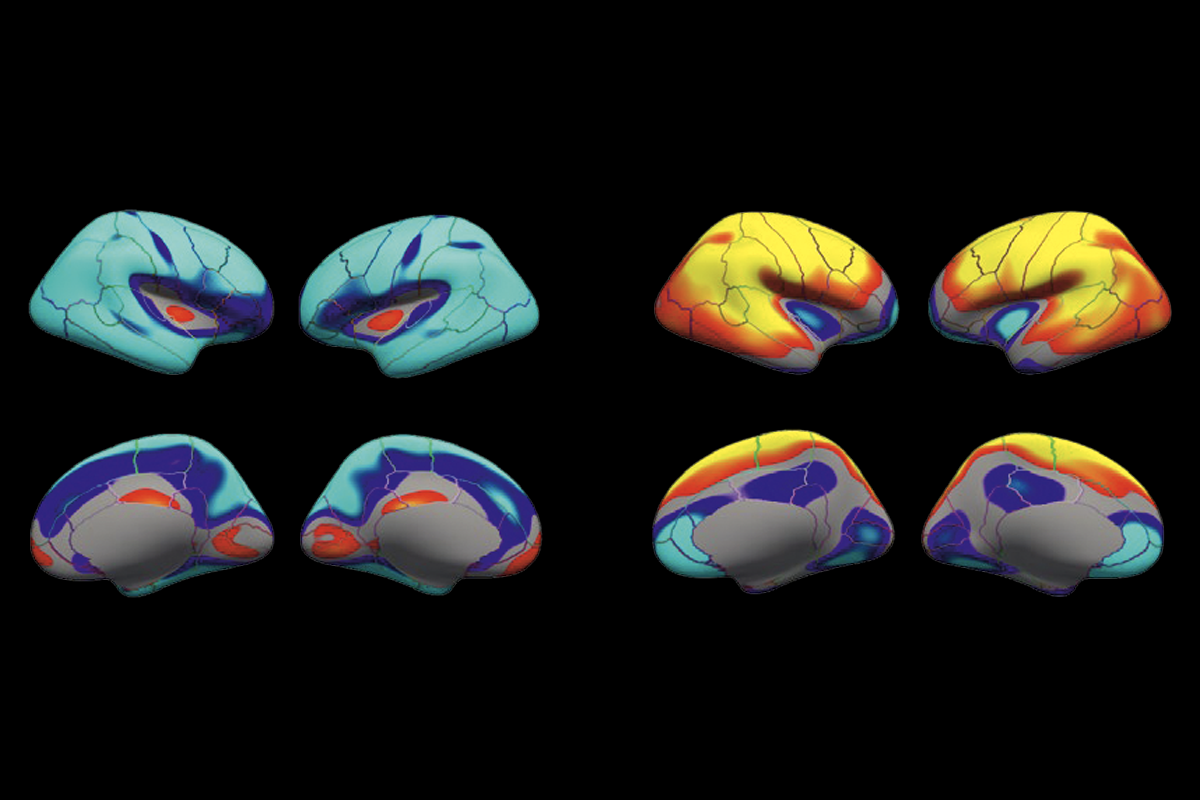
Analyses that include low-quality MRI data underestimate cortical thickness and overestimate cortical surface area, according to new findings from the Adolescent Brain Cognitive Development (ABCD) Study.
Low-quality scans introduce systematic bias into large-scale neuroimaging analyses, according to a new study.
The findings challenge the widely held assumption that larger sample sizes in neuroimaging studies yield more robust results that can counteract the presence of noisy images, says Joshua Roffman, associate professor of psychiatry at Harvard Medical School and principal investigator of the new work.
“This study is a plea for people to factor in quality control before they interpret their findings,” Roffman says. And it provides several practical recommendations to counter the challenge of noisy data—and ensure that researchers avoid publishing specious findings.
Poor image quality can taint the results of small neuroimaging studies, particularly those of adolescents, previous research has shown. The new study is one of the first to examine the problem of noisy data in massive-scale structural MRI (sMRI) datasets.
Roffman and his colleagues manually assessed the quality of more than 10,000 sMRI scans from the Adolescent Brain Cognitive Development (ABCD) Study, a landmark longitudinal neuroimaging project. More than half the images are of suboptimal quality, the team found, even after the data underwent a standard automated quality-control step.
Incorporating these scans in analyses introduced bias and inflated effect sizes, the study suggests. The findings were published on 1 July in Nature Neuroscience.
“Including lower-quality images can really make a substantial difference. And that’s alarming,” says Lucina Uddin, professor of psychiatry and biobehavioral sciences at the University of California, Los Angeles, who was not involved in the study. “It’s a reckoning for the field.”
L
arge MRI datasets are increasingly used to detect subtle brain-behavior links and to avoid the pitfalls of smaller studies, which are prone to producing false-positive findings or missing real effects. Data from the ABCD Study have been used in 1,500 publications. (The study’s latest data release excludes information on the participants’ gender identity and expression, The Transmitter previously reported.)Most researchers rely on the ABCD Study’s standard analysis pipeline to process and analyze the scans, according to Roffman and Uddin. It includes a pass/fail metric that allows almost all scans through, Roffman adds.
Motion artifacts, which degrade scan quality, are especially common in young children and those with neuropsychiatric conditions, who tend to have trouble lying still in the scanner. Increasing sample size generally reduces the effects of noise in neuroimaging studies, suggesting such artifacts would average out in sufficiently large datasets, Roffman says.
But this assumption only holds if motion creates random noise, Roffman explains. To investigate further, the team used a four-point scale to manually rate the quality of 10,295 sMRI scans collected from 9- and 10-year-olds as part of the ABCD Study. A rating of 1 meant minimal manual correction by a trained person was needed; 2 indicated moderate correction; 3, substantial correction; and 4, unusable data. Overall, 55 percent of scans received a rating of 2 or higher, and 2 percent of scans were deemed unusable.
Scan quality affects standard sMRI measurements, further analyses suggest. Lower-quality scans consistently underestimate cortical thickness and overestimate cortical surface area, and these errors grow as scan quality decreases, the study shows.
In an analysis of the 4,600 highest-quality scans, significant group differences appeared in three brain regions when comparing the cortical volume of children with or without reported aggressive and rule-breaking behaviors. Including scans that had a rating of 2 raised the number of significant regions to 21. Pooling all scans catapulted that number to 43.
“As soon as you add in 2s, the effect size more than doubles” in some regions, Roffman says. Because effect sizes should remain stable as sample size increases, even these moderate-quality scans are introducing error, he says.
Still, some true effects may only emerge in samples larger than 4,600, Roffman notes. To balance this trade-off, the team analyzed which brain regions reached significance as lower-quality scans were added back into the high-quality set. In nine additional regions, effect sizes remained consistent, suggesting that these were real effects, Roffman says.
B
ecause manually rating tens of thousands of scans is impractical, the team compared several automated quality-control metrics against their manual ratings. A measure called surface hole number (SHN), which estimates the number of holes or imperfections in a cortical reconstruction, did the best job of approximating manual ratings—although the researchers note that controlling for SHN didn’t eliminate error as effectively as manual ratings in the analysis of group differences.Using SHN as a proxy for scan quality could be a way to stress-test conclusions, the researchers argue. As one of several recommendations for handling large, automated datasets, Roffman and his colleagues propose that others use SHN to test how effect sizes change as they add or eliminate poor-quality scans. “It’s great that they propose an automated measure where, without actually looking at the data, you can flag which scans are good quality,” says Benjamin Kay, assistant professor of neurology at Washington University School of Medicine. “That’s really powerful.”
The recommendations are “really useful,” agrees Louise Mewton, associate professor of public health at the University of Sydney, who was not involved in the study but has worked with these data in the past. “They should be considered by everyone using data from the ABCD.”
Uddin expects that as quality-control algorithms improve, this systematic bias will become less of a problem, but we’re not there yet, she says.
“Most people aren’t doing things by hand,” Uddin says. “They’re taking the values that are released as part of the data release. So it’s sobering.”