This article is more than five years old.
Neuroscience—and science in general—is constantly evolving, so older articles may contain information or theories that have been reevaluated since their original publication date.
Researchers can share and compare brain-imaging data on the UCLA Multimodal Connectivity Database, described in the 28 November Frontiers in Neuroinformatics. The resource builds connectivity matrices, which estimate the strength of connections between regions of the brain.
Researchers can share and compare brain-imaging data on the UCLA Multimodal Connectivity Database, described in the 28 November Frontiers in Neuroinformatics1. The resource builds connectivity matrices, which estimate the strength of connections between regions of the brain.
By scanning many human brains, several groups of researchers are aiming to build maps of the connections that form across brain regions. These scans rely on various techniques, including functional magnetic resonance imaging (fMRI), which looks at blood flow to a region, and diffusion tensor imaging (DTI), which measures the rate of water diffusion along neuronal tracts.
Several data-sharing projects, such as the Alzheimer’s Disease Neuroimaging Initiative, encourage researchers to collect these data in consistent ways so that they can combine results from multiple projects.
The new database allows researchers to easily share data and includes 2,155 publicly available connectivity matrices, including 175 fMRI and DTI networks from children with autism.
Researchers can search among these networks, compare them with one another or with their own data and analyze what would happen if a certain area of connectivity were disrupted, or had a lesion.
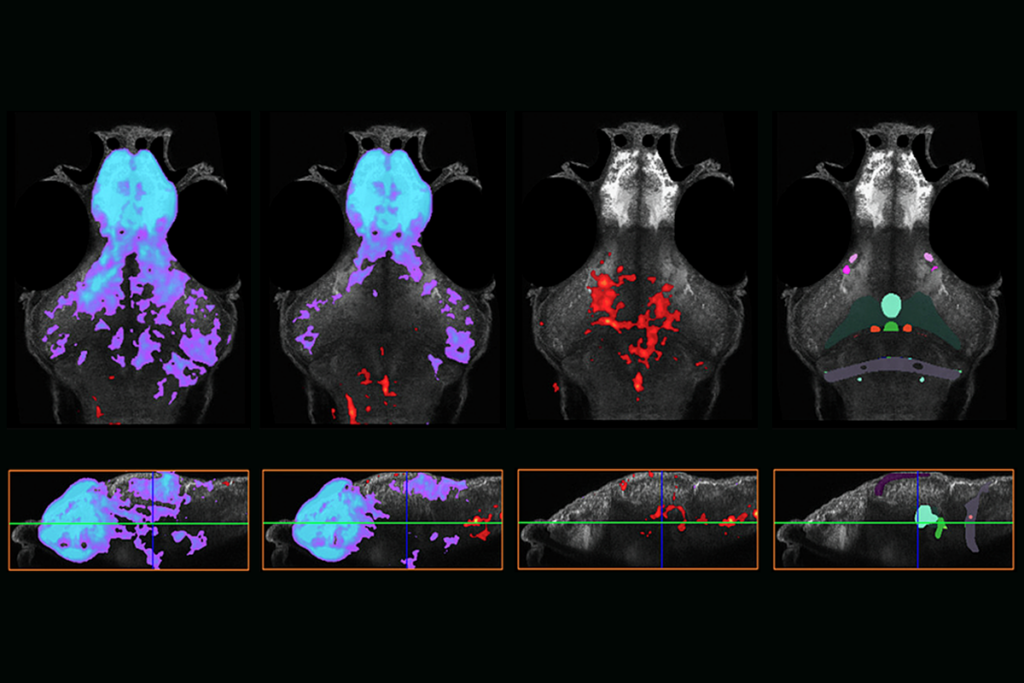
As a test of the tool, researchers compared fMRI with DTI connectivity matrices for 60 typical individuals, 26 to 45 years of age.
Using graph theory, the tool constructs three-dimensional networks from the combined data generated by type of brain scan. The resulting connectivity map looks different for each type of scan, suggesting the value of using multiple techniques, the researchers say.
1: Brown J.A. et al. Front. Neuroinform. 6, 28(2012) PubMed