Accounting for autism’s prevalence
Recent articles
Map of global autism prevalence
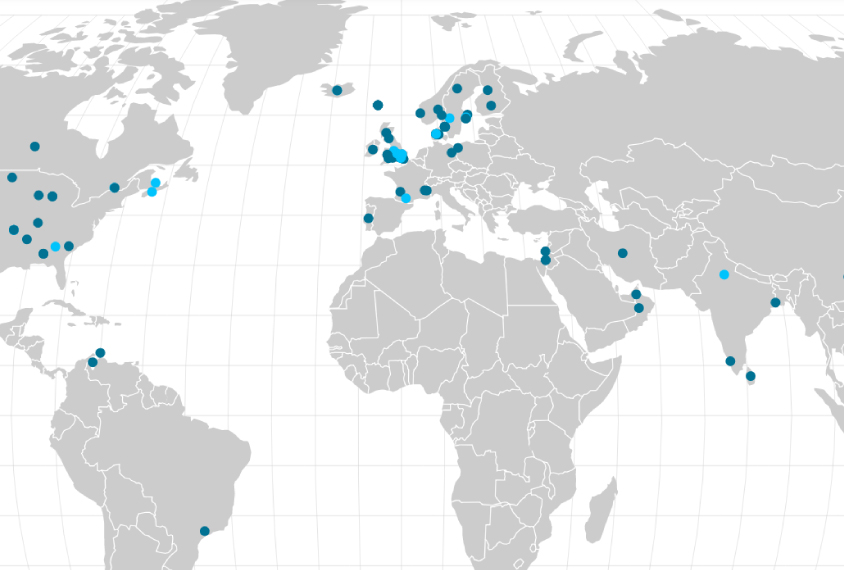
View an interactive map of studies on autism prevalence around the world. The map highlights places where information is available — and places where information is missing.
Map of global autism prevalence
View an interactive map of studies on autism prevalence around the world. The map highlights places where information is available — and places where information is missing.

U.S. study charts changing prevalence of profound and non-profound autism
Profound autism prevalence rose from 2002 to 2016, though not nearly as much as non-profound autism did.
U.S. study charts changing prevalence of profound and non-profound autism
Profound autism prevalence rose from 2002 to 2016, though not nearly as much as non-profound autism did.

U.S. autism prevalence continues to rise as race and sex gaps shrink, new stats show
About 1 in 36 children in the United States has autism, up almost 20 percent from the previous estimate, reflecting improved identification, particularly among girls and Black, Hispanic and Asian or Pacific Islander children.
U.S. autism prevalence continues to rise as race and sex gaps shrink, new stats show
About 1 in 36 children in the United States has autism, up almost 20 percent from the previous estimate, reflecting improved identification, particularly among girls and Black, Hispanic and Asian or Pacific Islander children.
Autism incidence in England varies by ethnicity, class, location
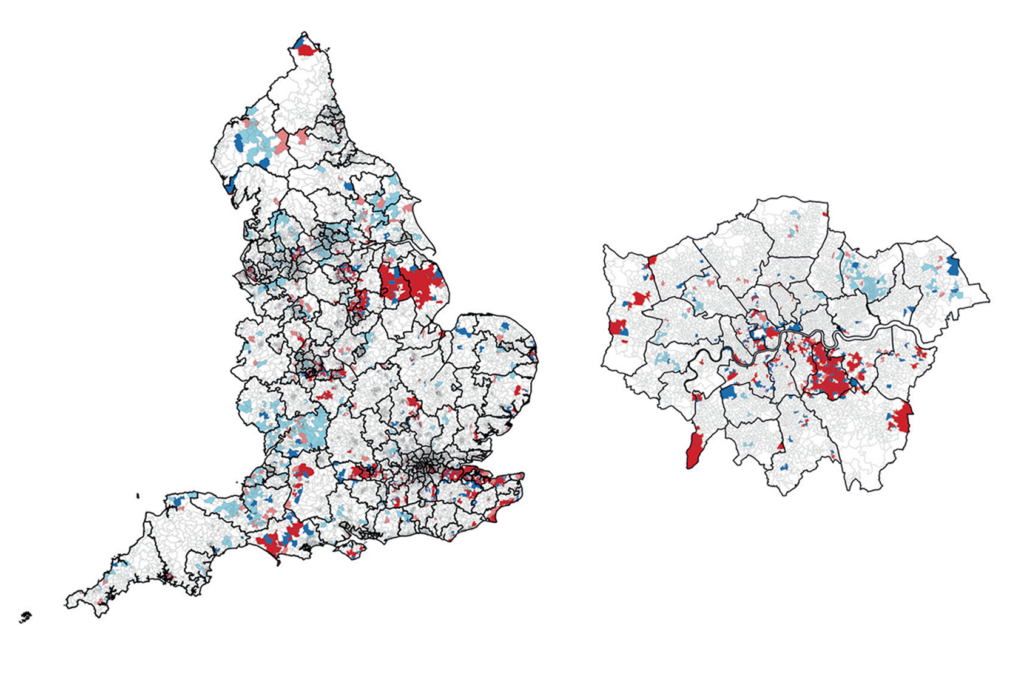
High rates of autism are linked to lower socioeconomic status and minority ethnic groups, according to the largest-ever autism incidence study.
Autism incidence in England varies by ethnicity, class, location
High rates of autism are linked to lower socioeconomic status and minority ethnic groups, according to the largest-ever autism incidence study.

Autism by the numbers: Explaining its apparent rise
Is autism really more common among children today than in generations past? This new downloadable book offers an in-depth guide to the various factors that have helped to drive autism prevalence numbers up.
Autism by the numbers: Explaining its apparent rise
Is autism really more common among children today than in generations past? This new downloadable book offers an in-depth guide to the various factors that have helped to drive autism prevalence numbers up.

U.S. autism prevalence inches upward as racial gaps close
Autism prevalence in the United States rose to 1 in 44 children in 2018, up from 1 in 54 in 2016.
U.S. autism prevalence inches upward as racial gaps close
Autism prevalence in the United States rose to 1 in 44 children in 2018, up from 1 in 54 in 2016.
Explore more from The Transmitter
University probe leads to retraction of four neural tube studies
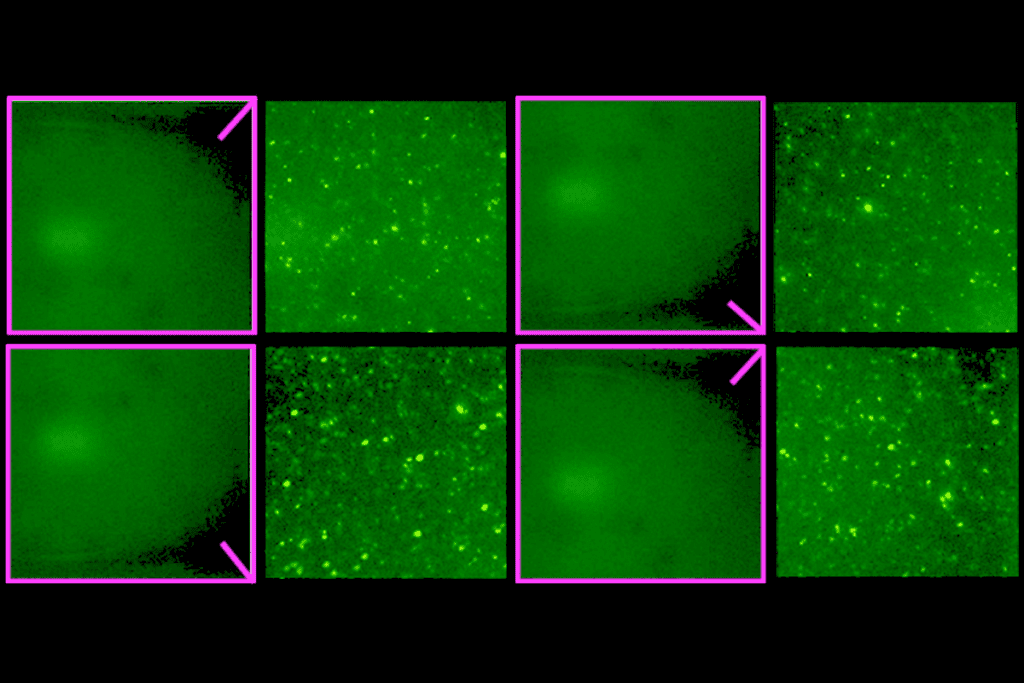
The University of Maryland conducted an internal investigation that identified image duplications and other data integrity issues in the studies, according to the retraction notices.
University probe leads to retraction of four neural tube studies
The University of Maryland conducted an internal investigation that identified image duplications and other data integrity issues in the studies, according to the retraction notices.

Highly cited autism paper earns expression of concern over data duplications
The notice, published in Nature last week, also addressed an image duplication identified by a prominent research-integrity sleuth.
Highly cited autism paper earns expression of concern over data duplications
The notice, published in Nature last week, also addressed an image duplication identified by a prominent research-integrity sleuth.
Govern neurodata by how it’s used, not where it’s from
New neurodata laws will shape how researchers gather, share and reuse brain data. A use-based governance protects basic researchers and those whose data are being used, without freezing science.
Govern neurodata by how it’s used, not where it’s from
New neurodata laws will shape how researchers gather, share and reuse brain data. A use-based governance protects basic researchers and those whose data are being used, without freezing science.